2015-04-27 Building Pump ChartsComment on this page
There are several approaches to managing the numbers used while pumping on the fireground. Most applications typically fall into one of two camps: “rules of thumb” or pre-calculated pump charts. This article explains how to go about building your own pump charts to suit your needs as an operator. It is an exercise that can make you more efficient in your role and provide a better understanding of the fundamentals behind your decisions at the pump panel.
This article does not discuss “rules of thumb.” These catch-all figures (either memorized or written) give the operator enough information to put into play simple fire streams. The downside is that they can result in a great degree of inaccuracy as the rules are usually too general to cover every possible situation.
Pump charts can provide accurate numbers for wider variety of fireground needs. Many departments provide charts for their operators and these can serve as a good starting point for your own charts.
The process of building personal pump charts can be broken down into the following steps:
- Inventory your apparatus, hose, nozzles and appliances
- Find out what the manufacturer says about the equipment
- Get Pump Pressure values by evaluating preconnected hose lays
- Get Nozzle Pressure values by examining your nozzles
- Precalculate Friction Loss for hose types and expected flows
- Include Appliance Loss and Elevation Pressure
- Build your pump charts using a spreadsheet
Everything in this process centers around the pump formula. The act of building pump charts is really about answering the questions posed by the formula.
Keep in mind that Pump Pressure is only Pump Pressure if that is the only line in operation. If there are multiple lines, actual Pump Pressure becomes the value of the highest pressure needed and all other calculations are for individual discharge ports with the valve gated back to the appropriate pressure.
Also, your version of the pump formula may use different terms (e.g., Back Pressure vs. Elevation Pressure) but the components are always the same.
If there are people in your department who are able to offer insight into department-issued charts it is a good idea to contact them with your questions. Often they will be more than happy to help you better understand how the department-issued charts are built.
Before we get started, here is a link to a PDF of completed pump charts. Your finished charts don’t need to look like these but they provide a good example of what can be done.
This article uses metric unit measurements but the concepts can be applied regardless of the units used. For the purposes of our examples we assume that hand lines come in 15 meter lengths and large volume supply line comes in 30 meter lengths.
Remember Your Pump Math
You will need some basic pump math to build your chart. The Pump Pressure formula above is essential but you will also need at least two other formulas.
For more pump math check out Pump Operations#Math.
Flow from a smooth bore nozzle
LPM = 0.067 x d² x √NP
Where:
| LPM | Liters per minute |
| d | Diameter of orifice in mm |
| NP | Nozzle pressure in kPa |
Friction loss in hose
The friction loss formula used by the IFSTA books is FL = C x Q² x L
Where:
| FL | Friction loss in kPa |
| C | Friction loss co-efficient |
| Q | Flow in 100s of LPM (LPM ÷ 100) |
| L | Hose length in 100s of meters (length ÷ 100) |
For the examples below, we have used a modified version of this formula where L is the number of 30 meter lengths of hose. This is because the friction loss co-efficients where the author works are based on hose in 30 meter sections -- not hose length in 100s of meters.
You should use whatever friction loss formula and coefficient is used in your department. If your department hasn’t adopted one already, it is fairly safe to fall back on the IFSTA formula and IFSTA Friction Loss Coefficients.
#1 - Inventory your apparatus, hose, nozzle and appliances
The first step in building your pump charts involves going through the apparatus and equipment that you want to include. You need to know what kinds of fire pumps are standard on your apparatus, the hose compliments, nozzles, appliances and master streams. You will also likely need to know the “fire stream” equipment found on other apparatus that you might pump into, such as ladder trucks.
For each piece of equipment, write down the type of equipment, model number and manufacturer. You will need this information for all but the most simple pieces of equipment such as wye and siamese appliances. If you don’t have the equipment handy at your hall but expect that you might need to pump into it, call the halls that have this equipment and get the information from the people who deal with the equipment on a regular basis.
When you record information regarding nozzles and smooth bore tips, be sure to record the diameter of the orifice. If the diameter is printed in a unit that you are not using (for example, imperial) you will need to convert it to the units used throughout your charts.
Also, depending on the units found on your equipment (e.g., you have selectable flow nozzles with imperial-only labels), you may need to list both the imperial and metric units on your pump charts for the sake of communication with your nozzleman. Always include your unit of choice alongside other measurements regardless of what is found on the equipment. You do not want to perform unit conversions on the fireground if it can be helped.
#2 - Find out what the manufacturer says about the equipment
For each piece of equipment on your list find the operating instructions and any other information provided by the manufacturer. Pay close attention to pressures, flow charts, friction loss numbers and operating ranges. You can often find this information on manufacturer websites. Some pieces of equipment may involve more than one component (e.g., master streams are often comprised of a base and one or more nozzles) so you may have to check multiple manuals.
This step not only gives you the information that you need to construct pump charts but can also provide a good opportunity to revisit important operating and maintenance instructions.
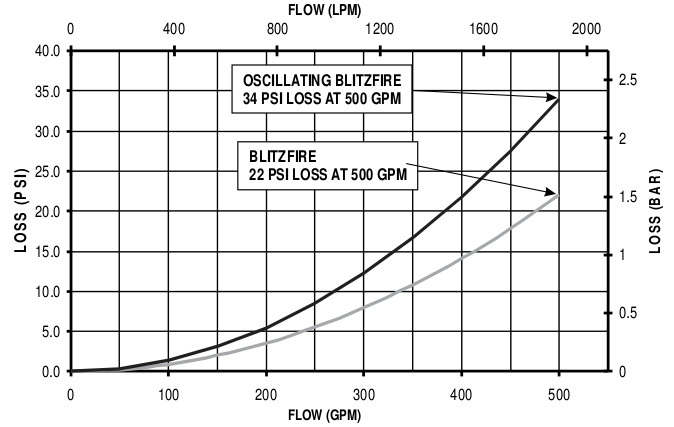
For example, in the department that I work at we use Blitzfire monitors. TFT provides both an instruction manual as well as a flow chart. From the instruction manual we learn that the maximum flow for this monitor is 2000 LPM, the device has considerable friction loss at higher flows and the flow chart provides useful numbers for the steps ahead.
#3 - Get Pump Pressure values by evaluating preconnected hose lays
A preconnected hose load is often used as-is. Because of this, pump operators can use a predetermined number of discharge pressures to supply these lines. This assumes that there are no other variables present (notably Appliance Loss and Elevation Pressure). If things change on the fireground the pump operator will have adjust accordingly.
Pump Pressure values can also come from hose lays that are not preconnected. So long as the hose length is predetermined, a specific nozzle is preattached and the lay is used as-is the values that apply to it can be used in your pump charts as Pump Pressures.
Let’s consider the following preconnected hose compliment for an engine:
- Bumper “trash line” with 2 lengths of 44mm hose finished with a 24mm TFT smooth bore nozzle
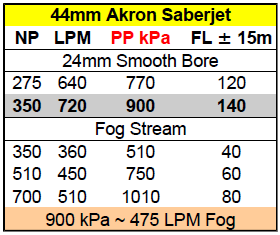
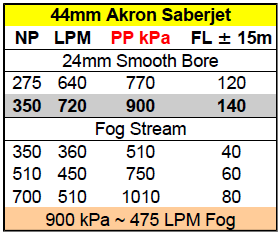
- Crosslay with 4 lengths of 44mm hose finished with a combination Akron Saberjet nozzle with 24mm smooth bore
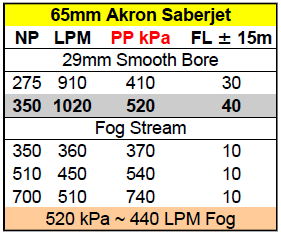
- Crosslay with 4 lengths of 65mm hose finished with a combination Akron Saberjet nozzle with 29mm smooth bore
For each preconnect we will need to know:
- Nozzle type & pressures
- Flow rates at specific nozzle pressures
- And for each flow rate…
- Total friction loss in the usual number of hose lengths
- Average friction loss per length of hose
To get go-to discharge pressures for the preconnected lines we will add together Nozzle Pressure and total Friction Loss. We will also provide the corresponding flow rates so operators can keep track of how much water is moving and average friction loss per length of hose so operators can easily adjust for the addition or removal of hose lengths.
Here’s what our charts look like.
Preconnected bumper line
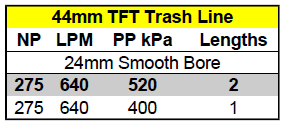
This preconnect consists of 2 lengths of 44mm hose finished with a 24mm TFT smooth bore nozzle & shut-off.
This chart is organized into the following columns:
- Nozzle pressure (NP)
- Corresponding flow in liters per minute (LPM)
- Pump Pressure in kPa (PP kPa)
- Number of lengths of hose (Lengths)
In our example this preconnected line is typically used for small vehicle fires or trash fires and isn’t likely to be extended so we keep it simple. There are two probable options for this line: either it is used with the full two lengths or reduced to one length.
Both precalculated options use the same Nozzle Pressure and therefore flow at the same rate. We didn’t bother to provide more than one nozzle pressure since this line is unlikely to be used for structure fires and we want to keep nozzle reaction at a minimum for the sake of the firefighters on the handline.
Let’s break down the math for this chart:
| NP | LPM | PP kPa | Lengths |
|---|---|---|---|
| 275 | 0.067 x 24² x √275 = 640 LPM | 275 + 245 Friction Loss = 520 kPa | 2 |
| 275 | 0.067 x 24² x √275 = 640 LPM | 275 + 120 Friction Loss = 400 kPa | 1 |
For 2 lengths of 44mm hose, friction loss for 640 LPM is calculated as:
FL = C x Q² x L
   = 6 x (640 ÷ 100)² x 1
   = 6 x 6.4² x 1
   = 6 x 40.96 x 1
   = 245.76
FL = 245 kPa (rounded)
Recall that our version of the friction loss formula assumes L to be the number of 30 meter lengths. Since handlines come in 15 meter sections and we are dealing with 2 lengths of 44mm hose, L = 1.
For 1 length of 44mm hose, friction loss for 640 LPM is calculated where L = 0.5:
FL = C x Q² x L
   = 6 x (640 ÷ 100)² x 1
   = 6 x 6.4² x 1
   = 6 x 40.96 x 1
   = 122.88
FL = 120 kPa (rounded)
As you can see, the only difference between the two options is the Pump Pressure needed to overcome the friction loss in one length vs. two lengths. Using this preconnected line, here’s how you should read the pump chart for this line:
- If you want to flow 640 LPM down 2 lengths you need to pump at 520 kPa.
- If you want to flow 640 LPM down a single length you need to pump at at 400 kPa.
Preconnected 44mm crosslay and 65mm crosslay
The pump pressures for our 44mm and 65mm crosslays look very much like the pump pressure chart for the preconnected bumper line. Keeping like information similarly organized will be much appreciated by whomever uses your charts.
In our example, there are two major differences from our preconnected bumper line:
- These lines are typically used for structure fires or conditions where the line length may need to be extended.
- The Akron Saberjet nozzle is a combination nozzle with different flows and pressures for the smooth bore and fog orifices.
Because these lines may be used for structure fires we have supplied a couple of different nozzle pressures and flow rates for the smooth bore. Nozzle pressure in a smooth bore directly affects the flow rate and thus nozzle reaction.
Although it is not shown here, the pump charts can have a side note so pump operators know how much nozzle reaction firefighters will experience depending on the flow. If there are fewer firefighters on the nozzle the flow may need to be adjusted to allow crews to work more effectively (this is a conversation that should to happen with your nozzleman before the fire!).
Also, because these lines may be adjusted in length we have provided a per-length friction loss average to help pump operators quickly adjust for friction loss if the line needs to be extended or reduced.
Finally, the fog stream pressures and flows came directly from the Akron website.

In the 44mm Akron Saberjet example, the flows for the 24mm smooth bore outlet were calculated as follows.
LPM = 0.067 x d² x √NP
    = 0.067 x 24² x √275
    = 0.067 x 576 x 16.58
    = 639.885
LPM = 640 (rounded)
Since the Pump Pressure is determined by adding the Nozzle Pressure and Friction Loss we calculated the PP kPa of first line of the 44mm Akron Saberjet as follows:
FL = C x Q² x L
   = 6 x (640 ÷ 100)² x 2
   = 6 x 6.4² x 2
   = 6 x 40.96 x 2
   = 491.52
FL = 490 kPa (rounded)
PP = NP + FL
   = 275 + 490
   = 765
PP = 770 kPa (rounded)
The average Friction Loss per 15m length is then calculated by taking the FL value and dividing it by the number of lengths in the hose lay, in this case 4.
FL per 15m = 490 ÷ 4
           = 122.50
FL per 15m = 120 kPa (rounded)
It is much easier to deal with "simpler" numbers so you should round values on your pump charts wherever it is helpful to do so. Keep the margin of error introduced by rounding as low as possible.
#4 - Get Nozzle Pressure values by examining your nozzles
For hose lines that are not preconnected or do not have a set length and nozzle, pump operators cannot rely on Pump Pressure values that were explained in the previous step. Instead, operators will need to use the pump formula.
The first piece in this formula is Nozzle Pressure. Since nozzle pressure determines flow, your pump charts should include a section that outlines your nozzle sizes, acceptable nozzle pressures and corresponding flows. This is a straightforward process for smooth bore nozzles but automatic fog nozzles will require that you look to the manufacturer for values or perform your own tests.
Automatic fog nozzles differ in nozzle pressures and flows. 700 kPa at the tip is the generally accepted pressure for these nozzles but flow will vary greatly depending on the nozzle design, inlet size and other factors. Some fog nozzles are designed to function at lower pressures between 300 and 550 kPa and may flow different volumes at different pressures. Make time to get to know your equipment!
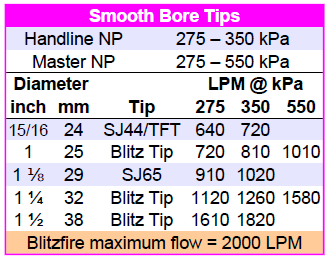
Here we see a pump chart for Smooth Bore Tips. The chart sets out ranges for handline and master stream nozzles. Below that, nozzle size and tip type are specified along with flow at different nozzle pressures. With the information that was collected in step #1 (Inventory your apparatus, hose, nozzle and appliances) building this chart is easy.
Note that imperial units have been provided for the different nozzle sizes. This is because some of the nozzles are labelled with imperial units vs. metric units that we use everywhere else. It is much easier for operators to simply look up the equivalent on the chart then try and remember everything at 3am when the pressure is on.
Each line in this chart has been calculated using the formula for determining flow from a smooth bore nozzle. For example, flows for the 38mm Blitz Tip were calculated as follows.
For 275 kPa nozzle pressure:
LPM = 0.067 x d² x √NP
    = 0.067 x 38.1² x √275
    = 0.067 x 1451.61 x 16.58
    = 1612.521
LPM = 1610 (rounded)
For 350 kPa nozzle pressure:
LPM = 0.067 x d² x √NP
    = 0.067 x 38.1² x √350
    = 0.067 x 1451.61 x 18.70
    = 1818.705
LPM = 1820 (rounded)
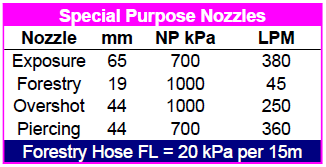
You may also want to include nozzle pressure charts for other kinds of nozzles. There is no real limit to the number of nozzle charts that you include so long as they are practical and applicable.
#5 - Precalculate Friction Loss for hose types and expected flows
In your role as a pump operator you are responsible for managing multiple hose lines, keeping an eye on incoming and outgoing water, thinking about ways to increase supply, possibly stretching lines, readying equipment or even manning an exposure line if manpower is an issue. People who have pumped at more than a few fires will attest to the fact that you will rarely have time to perform friction loss calculations on the fireground.
Luckily we have ample time to work this out before the next big one. We know that friction loss is dependant on three factors:
- Friction loss co-efficient (for hose of a given diameter and type)
- Volume of flow
- Length of hose
These three things should appear in our Friction Loss calculations.
Since we have already inventoried our equipment and know the hose sizes that we are going to use, looking up the corresponding friction loss co-efficient values is a simple exercise.
The range of flows that we can encounter is also already known. We discovered these values when we figured out our possible Pump Pressures and Nozzle Pressures. For example, if we are supplying a 44mm line the flows we may encounter are:
| 250 LPM | Overshot applicator @ 1000 kPa |
| 360 LPM | Piercing nozzle @ 700 kPa |
| 360 LPM | Saberjet – fog stream @ 350 kPa |
| 450 LPM | Saberjet – fog stream @ 510 kPa |
| 510 LPM | Saberjet – fog stream @ 700 kPa |
| 640 LPM | Saberjet – smooth bore @ 275 kPa |
| 720 LPM | Saberjet – smooth bore @ 350 kPa |
Since friction loss is independent of nozzle pressure we only need to include values for 360 LPM once.
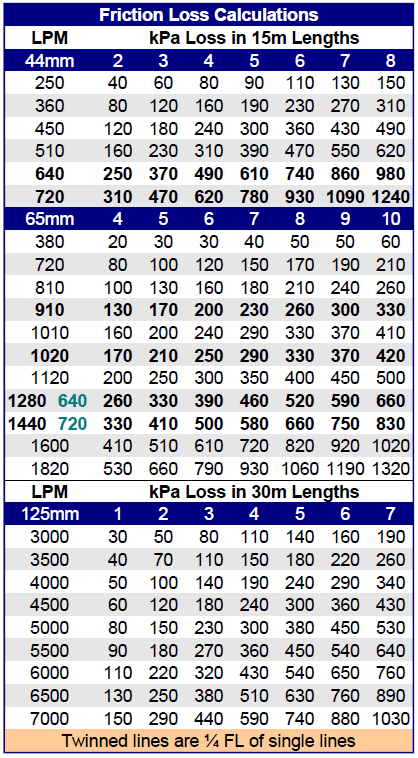
Below you can see friction loss calculated for 44, 65 and 125mm hoses. For the handlines, we have only figured for flows that we are likely to encounter as per our pump and nozzle pressures.
For the 65mm calculations we have included two special lines for volumes of 1280 and 1440 LPM. This is because it is common to use a single 65mm handline to supply two 44mm handlines via a gated wye.
The calculations for 125mm supply line at the bottom of the chart are not as fine grained. This is because the friction loss in high volume supply line is so much lower than handlines so relatively small differences in flow are less significant.
#6 - Include Appliance Loss and Elevation Pressure
The last two values that need to be taken into account are Appliance Loss and Elevation Pressure.
Appliance loss
Friction loss from appliances (e.g., things that water flows through other than hose) has the same effect that friction loss from hose does and needs to be figured into our pump formula.
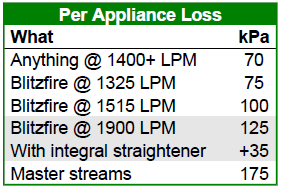
Appliance Loss will vary from device to device and may also vary with flow (in fact, it always varies with flow but in some cases may be insignificant without large volume flows). As with anything else, actual pressure measurements are best but in the absence of practical tests you should fall back on information provided by the manufacturer.
The IFSTA Pumping Apparatus Driver/Operator Handbook outlines some reasonable figures for appliance loss. Simple devices that flow more than 1400 LPM (e.g., wye, siames, water thief) lose approximately 70 kPa for each device and the monitors in master stream devices lose approximately 175 kPa towards the upper end of their flow capacity.
Also, when we read the operating instructions for the TFT Blitzfire portable monitor we found that it provides a nice graph that we can use to determine friction loss in the Blitzfire at various flows.
The moral of the story here is clear: read the operating instructions for all of your equipment. You will learn valuable information by becoming better acquainted with your tools.
Elevation pressure
Elevation Pressure is probably the most basic of values that we need to supply for our pump charts. This is a value that increases or decreases the required Pump Pressure based on the elevation of the nozzle in relation to the elevation of the pump.
If the pump is located below the nozzle then additional elevation pressure will be required to overcome the effect that gravity has on water moving in an upwards direction. Conversely, if the nozzle is located below the pump then elevation pressure needs to be reduced because water moving downwards gains pressure from the effect of gravity.
Elevation pressure is commonly referred to either in meters or stories, with one story being equivalent to 3 or 4 meters. The simple chart on the right gives these values for reference.
Aerial elevation pressure
When pumping into aerial or ladder trucks with waterways elevation pressure becomes more complicated to determine since both the degrees of inclination of the ladder and the length of ladder extension play a part in the actual elevation of the nozzle. The effect that these factors have on the height of the nozzle can be precalculated by using a Right Triangle Angle and Side Calculator.
Once the height of the vertical side of the triangle formed by the aerial is known, the elevation pressure can be determined by multiplying the height of the vertical side by the pressure gained by elevation (in this case 10 kPa per meter). An example of a precalculated chart with these numbers can be seen on the right.
#7 - Build your pump charts using a spreadsheet
You can use just about anything to produce a pump chart but spreadsheet software such as Microsoft Excel or OpenOffice Calc work especially well for these kinds of exercises for two specific reasons.
- Spreadsheets offer a high degree of layout control for information that is presented in rows and columns and this translates well to pump charts.
- Spreadsheets allow authors to embed the actual math used to produce the calculations found in the pump charts within the pump charts themselves. This saves authors from having to maintain an extensive collection of notes explaining how the pump charts were created.
The use of Excel or similar software is beyond the scope of this article, however there are a few tips that will make your life easier when creating your pump charts.
- Set column width to 1cm. This will create a more compact layout and allow for greater layout control throughout your charts. Two or more 1cm cells can be merged to create longer spaces to store information if need be.
- Be judicious with your use of colours and formatting. Charts with fewer colours and more uniform formatting will be easier on the eye. Colour and formatting can be used to enrich information in your charts but there is no reason that it should look like a Christmas tree.
- Most numbers on your chart should have a calculation behind them. As mentioned above it is possible to use this calculation in your spreadsheet. Do this and you won’t wonder how you arrived at a value several months from now. Also, this provides others who you give your charts to the option to easily deconstruct the information they find on them.
Once you’ve created your charts you can have them printed on a colour laser printer and laminated. Print your charts on 100lb cardstock and you’ll find they stand up much better over time.
Summary
As with all things, pump charts are only as good as the operator who is using them and in the end they are just numbers. Make sure to listen to the guys on the end of the nozzle and be quick to respond to their feedback. The universal “thumbs up” or “thumbs down” hand signals or radio requests for more pressure or less should take precedence over your own numbers.






 Last edited 2015-08-03 05:29 UTC by
 ![[Twitter]](/img/twitter_box.png)
![[RSS]](/img/rss_box.png)